Dukasaur wrote:mookiemcgee wrote:We know it hasn't even come close to the top yet cus dumb retail like you is saying sell instead of buy. 18 months from now when you 401k manager starts buying BTC ETFs because they have FOMO and are worried about a dollar crash is the top signal I'll be waiting for to sell.
Okay, I do have a question about this.
According to stock-and-flow articles that you sent me previously, there should be a big dip before the halving. This hasn't happened, and although I do still have a bit of BTC, I was waiting for the dip to buy some more.
I know this isn't a typical year. Is the pre-halving dip erased?
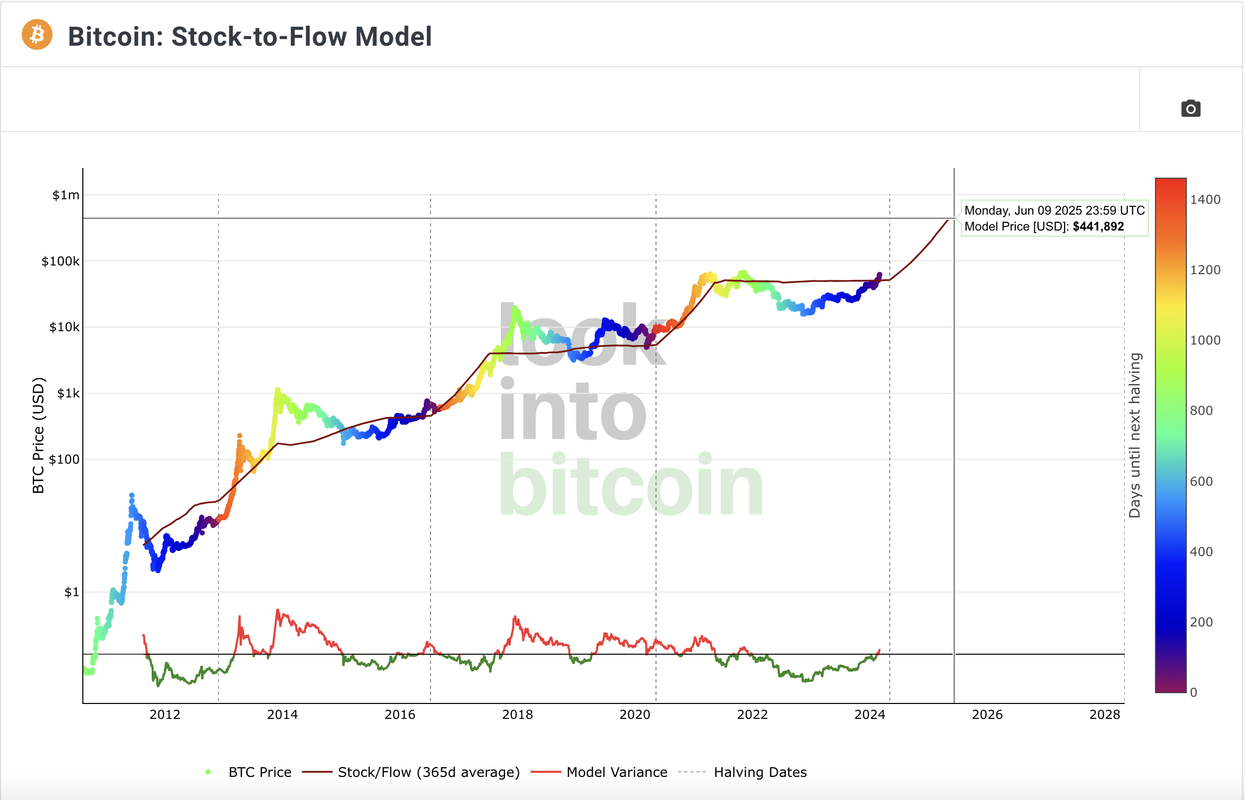
Tough one to answer concisely but I'll take a crack at it. Let me start by saying when I try looking back at the image below, there has not been much of a 'dip' just shortly (3-6 months) before a halvening. Most of the low points of the dips have been a full year to a year and a half prior to the halvening so the basic answer to your question might be that you already missed the dip (but the same chart suggest you are very far from being 'too late' to buy).
A longer and more thoughtful answer:
Some consider stock to flow a bit outdated, it's basically putting all the weight of it's analysis on supply side of the economics and not really factoring in any nuance to demand. The halvening is effectively a supply side phenomenon, miners start earning 1/2 as much bitcoin, and traditionally miners have been the main sellers of bitcoin. Many feel the main reason for the recent pump is all about the demand side, mainly the approval of these spot ETF we've been waiting on for 8 years, which are allowing in institutional money for the first time and that results in actual buying of bitcoin (futures ETFs don't result in any open market buying of bitcoin directly).
Its also worth noting we only just retook the stock to flow line on the chart in the last month or so after being under it for the better part of 2 years (that probably was the dip). Stock to flow also puts BTC price around $450,000 at the start of 2026, so you could still view now as 'the top end of the dip'... sure $30k 9 months ago, now 70k feels like you missed the dip but if it's going to 450k in 2 years this is still the dip. It could also see a drift back down to 40-45k between now and may/june when the halvening actually happens if ETF inflows slow down and there is a period of profit taking. No one is really predicting that is going to happen but it certainly could, and the new institutional money could lead to more general 'fuckery' around pricing designed to trap dumb retail money who will buy high and sell low. Truly free markets in general resist being entirely predictable, but also can't ignore the real world for long periods of time.
As I try to keep an open mind, there is also the possibility all of this is bullshit and the past 10-15 years of the charts accuracy means nothing and BTC is going to zero like my investment advisor Pack Rat believes. I will of course be naming my yacht Pack Rat someday to commemorate the great advice I've received here.
For those who don't know what the f*ck Duk is referring to, Stock to Flow attempts to estimate where the price of BTC could be based on supply mechanics and estimations of the adoption curve. The image below is the chart as of today going back to the ideas inception. Stock to flow ONLY applies to bitcoin, and virtually all other coins have abandon proof of work, in favor of proof of stake or other forms of proofing. That said, when BTC go up, most alts go up bigly covfefe also.


